Case study · Sprinklr
From insight to action
One connected workspace where Sprinklr teams capture insights, give them meaning and act on them, without exporting to five other tools.
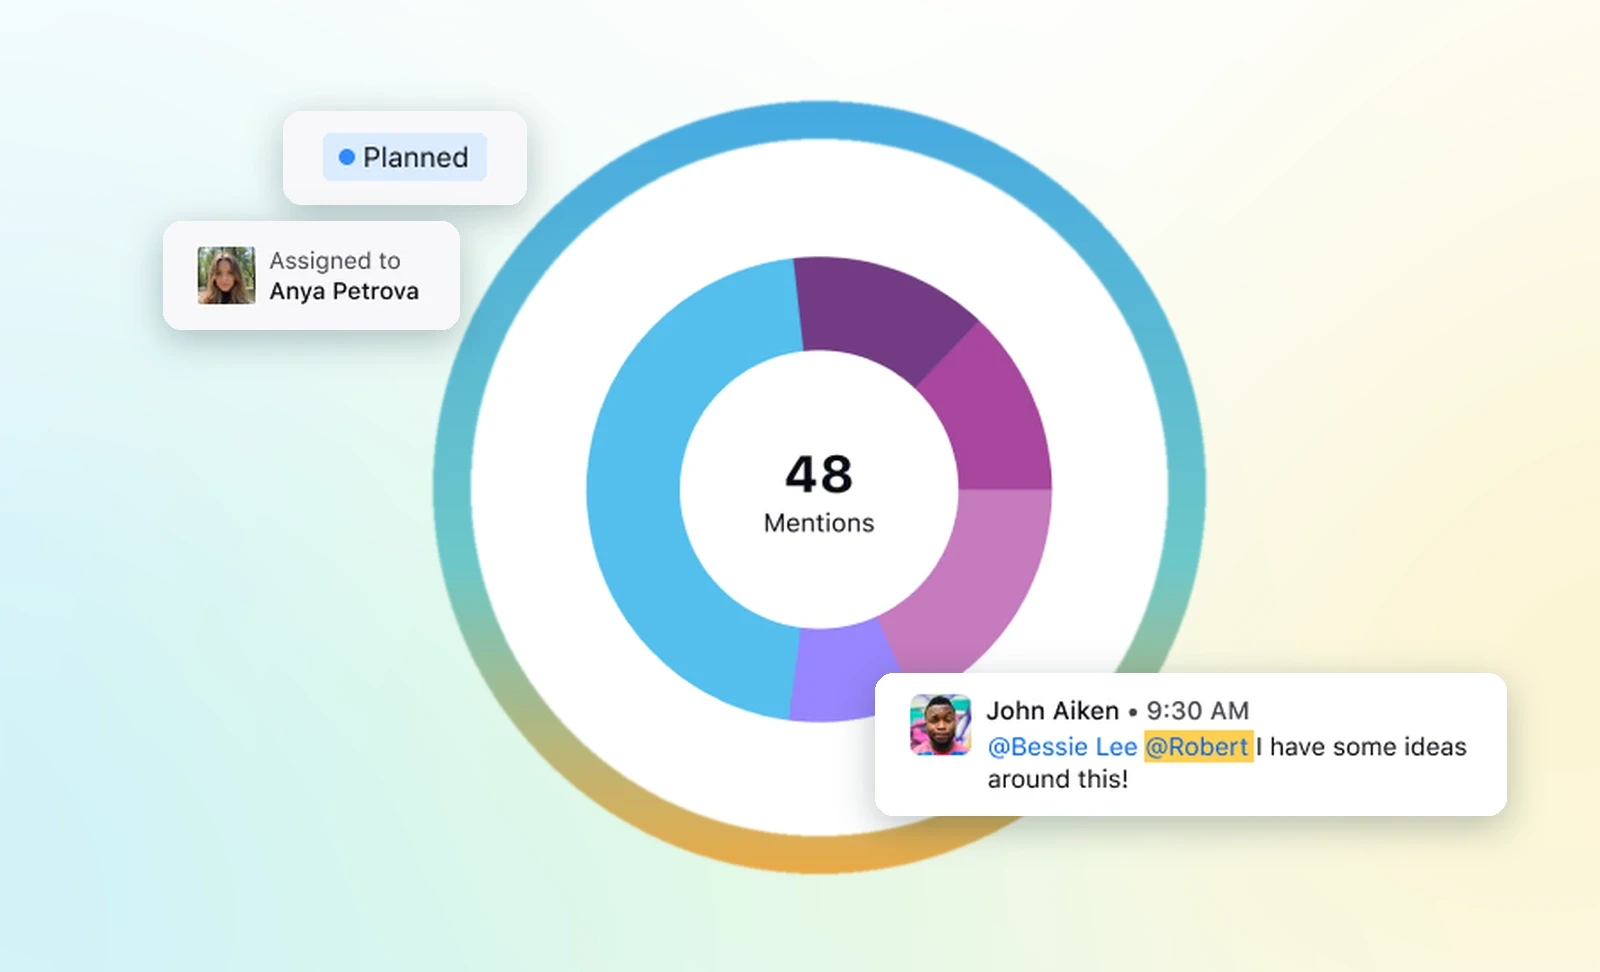
- Problem and role
- Sprinklr helped teams find insights, but sharing and acting on them happened in Excel, Power BI and slides, where context got lost. I led the design, and the Capture, Create, Act framework.
- Team and scale
- Lead Product Designer with 1 UX researcher, 2 PMs and 4 engineers. Jul 2025 to Sep 2025. In beta.
- The idea
- Keep every insight, its action and its owner in one place, linked from start to finish.
Outcome
24%
adoption in beta
40%
insight-to-action conversion
46%
interaction rate
The insights weren’t missing. They were fragmented.
Context
The insights were there. The story was not.
Vineet is a Quality Program Manager at a global brand. His team uses Sprinklr to spot spikes in sentiment, recurring issues and patterns in product conversations.
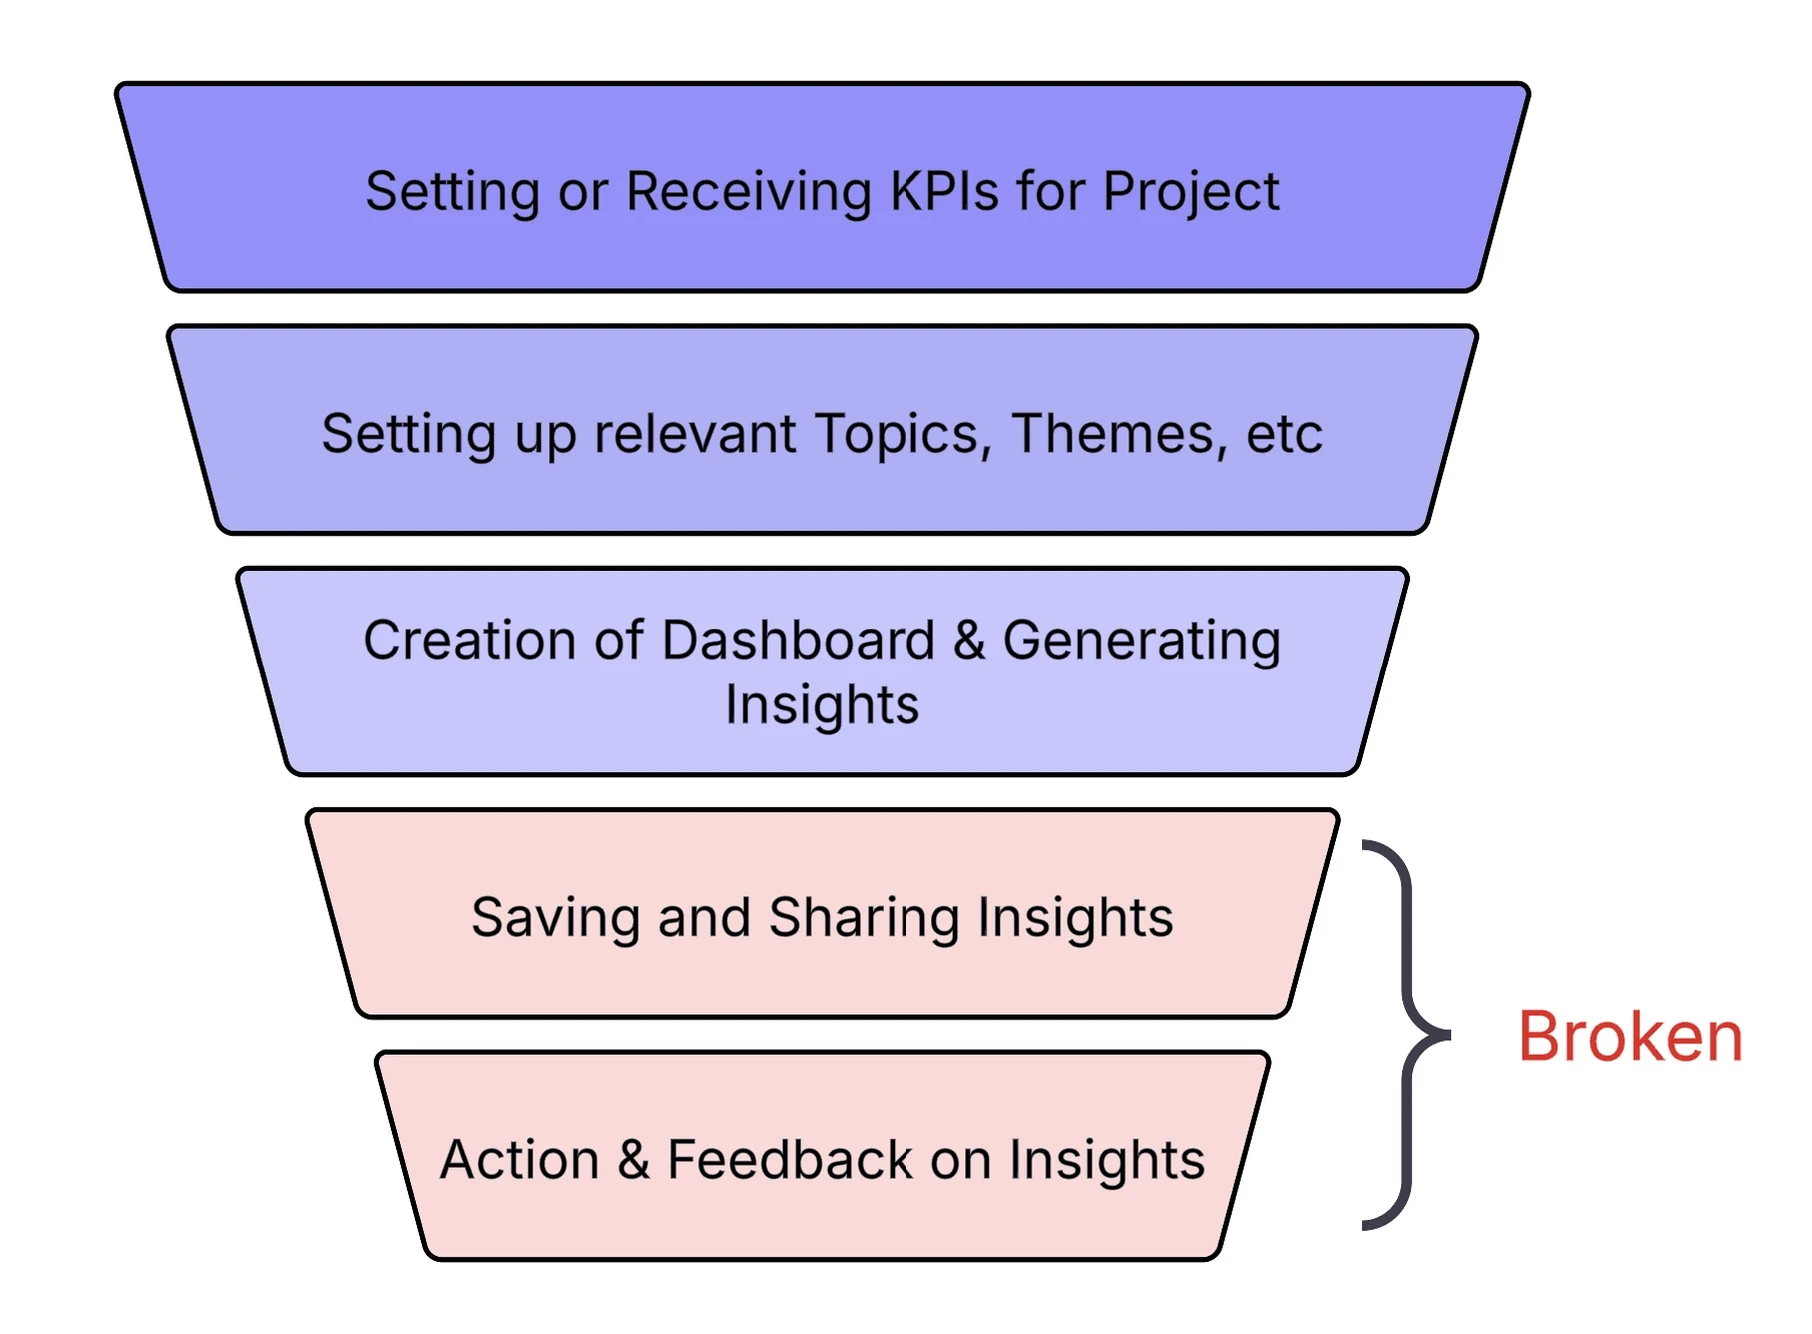
Capturing those signals worked. The trouble started afterwards: to dig deeper, show trends or share reports, the team exported data to Excel, Power BI or presentations. Each tool held a piece of the story, and none kept the full context.
Research
Each team saw a piece of the truth
No one saw the whole picture. Interviews confirmed that people managed insights in Canva, Excel and Power BI. We prioritised three pain points.
01
Fragmented insights
Scattered sources and no contextual filtering made relevant insights slow to find.
02
High cognitive load
Sifting through large volumes of data by hand caused fatigue and slower decisions.
03
Low actionability
Insights did not stand out, so analysts and social teams struggled to act on them.
The aha moment
Capture, Create, Act
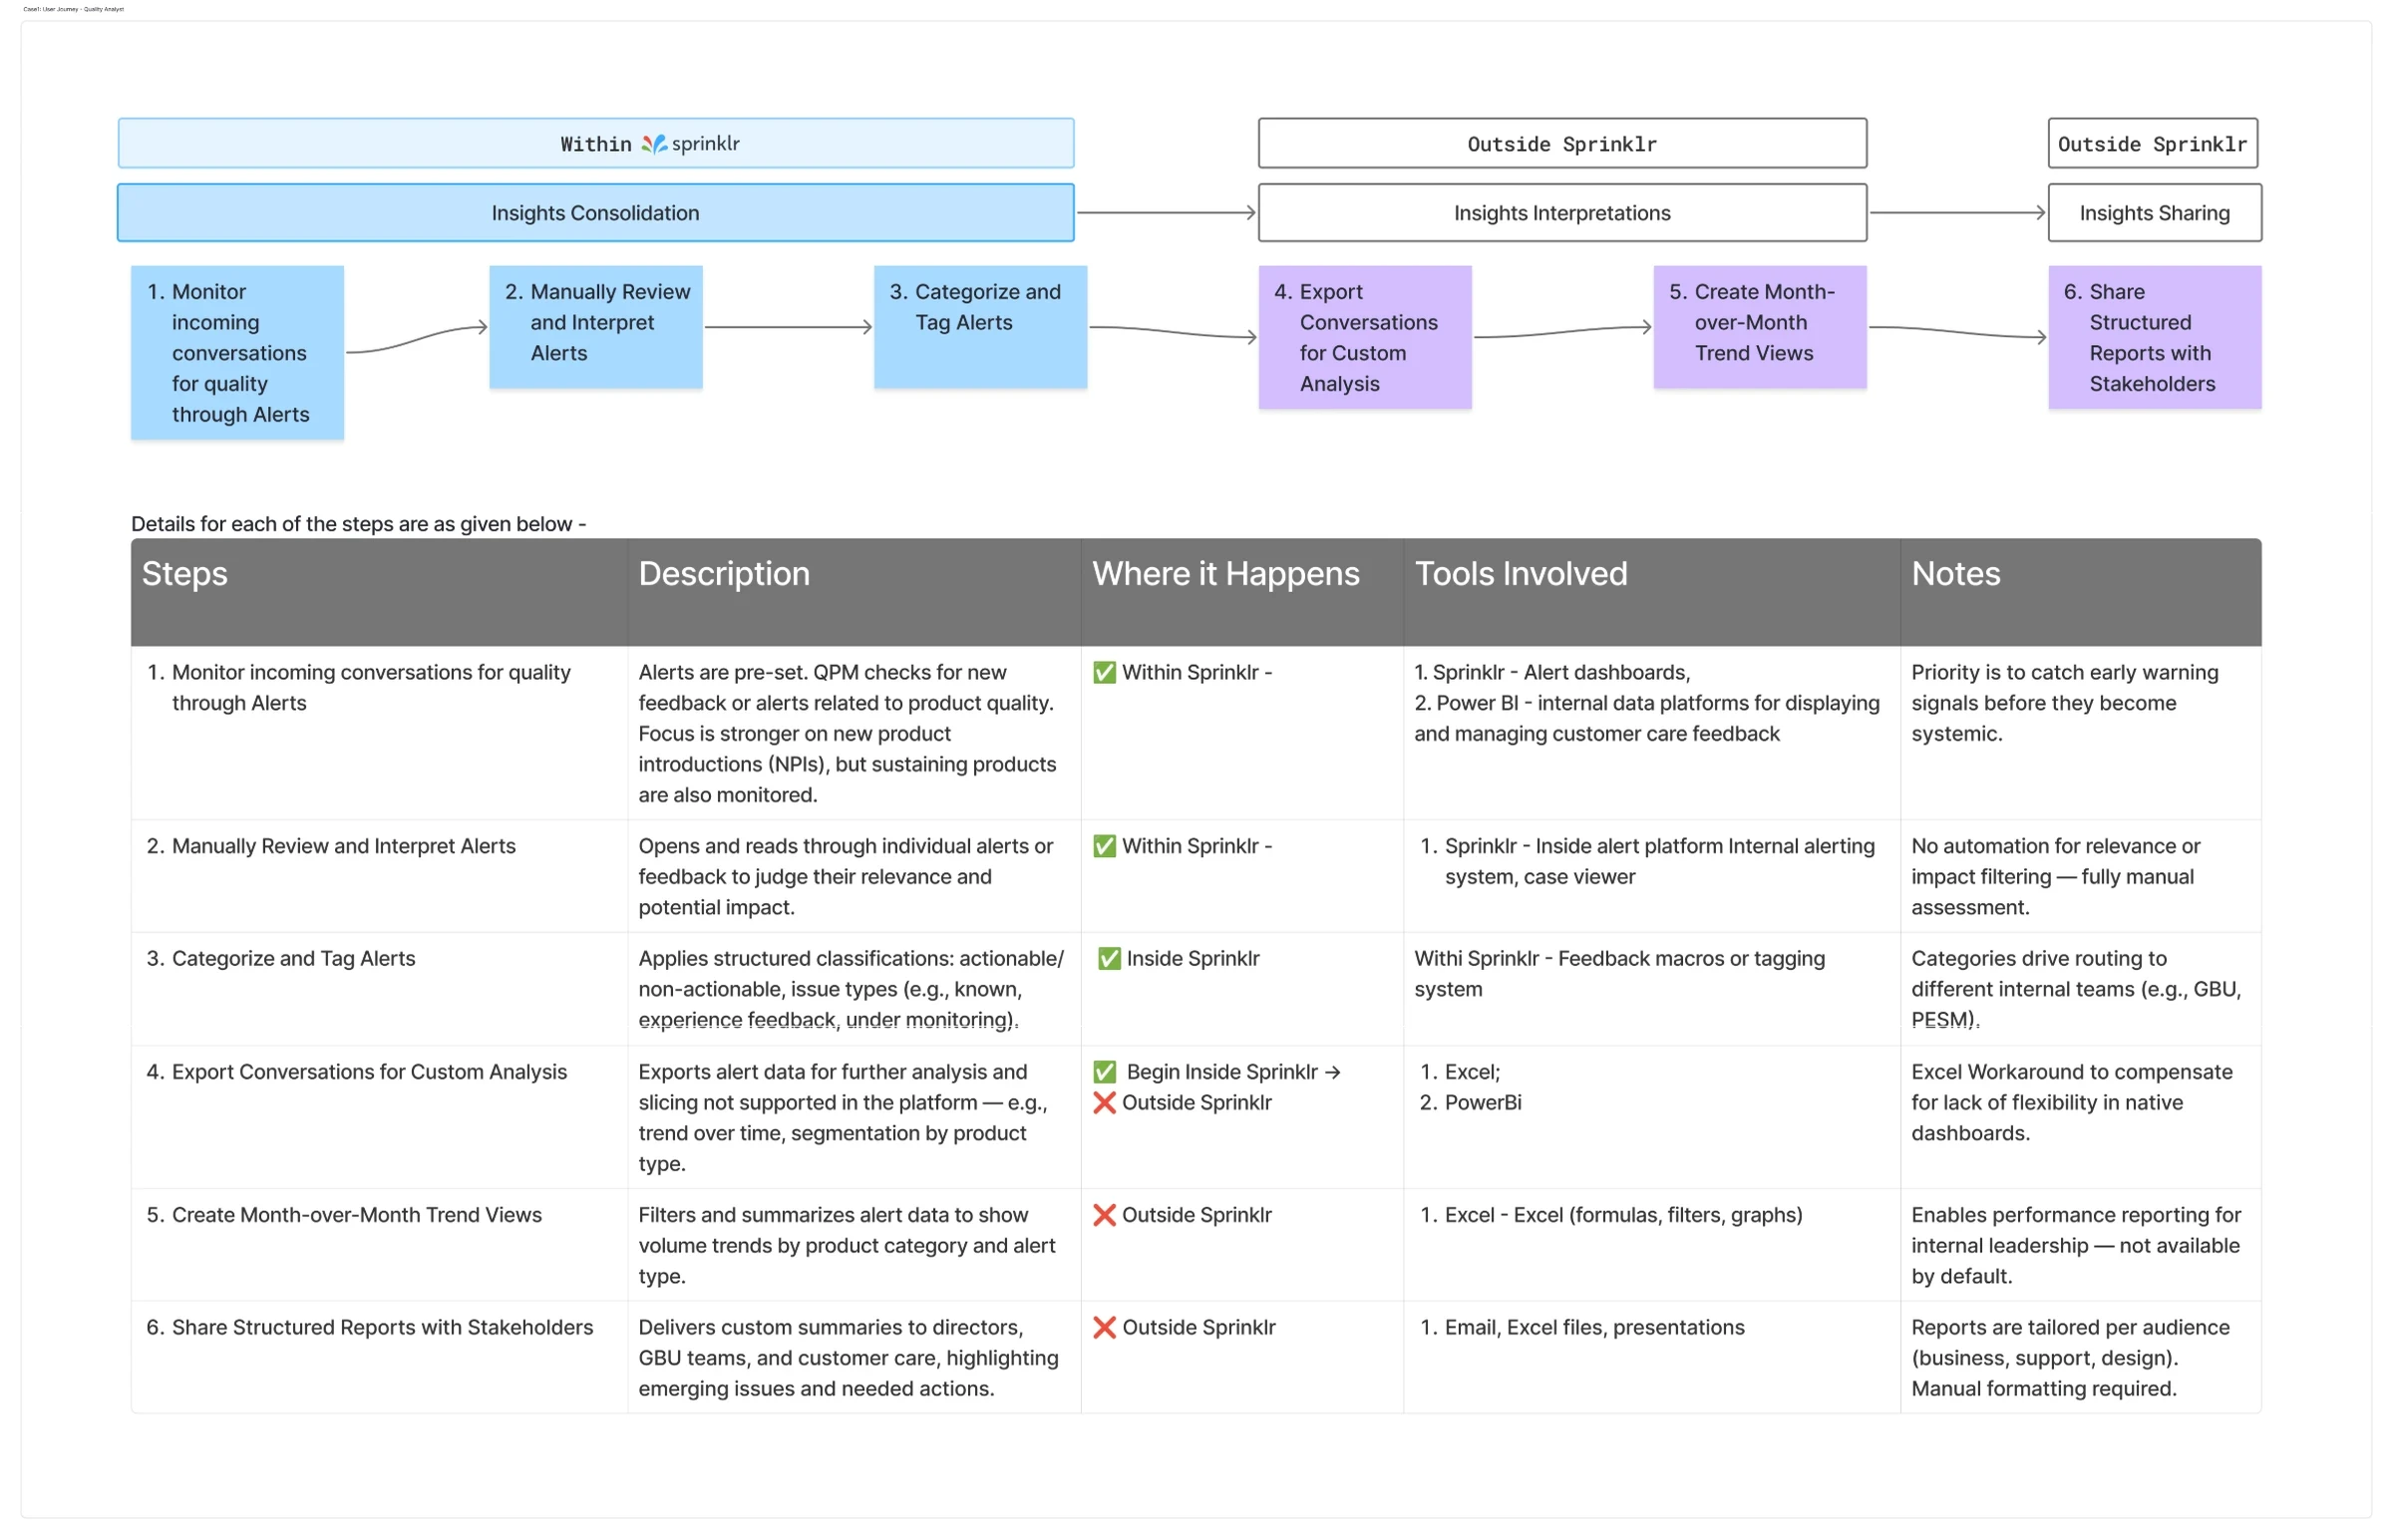
While mapping these journeys I noticed the same rhythm in every team and tool. People captured what mattered, created meaning around it, and acted on what they learned. The framework wasn't a process we imposed. We simply made it visible.
01
Capture
Save an insight right where you spot it, whether it is one trend or a cluster of signals, so the flow stays alive.
02
Create
Turn understanding into an action plan with an owner, a timeline and the reason it matters.
03
Act
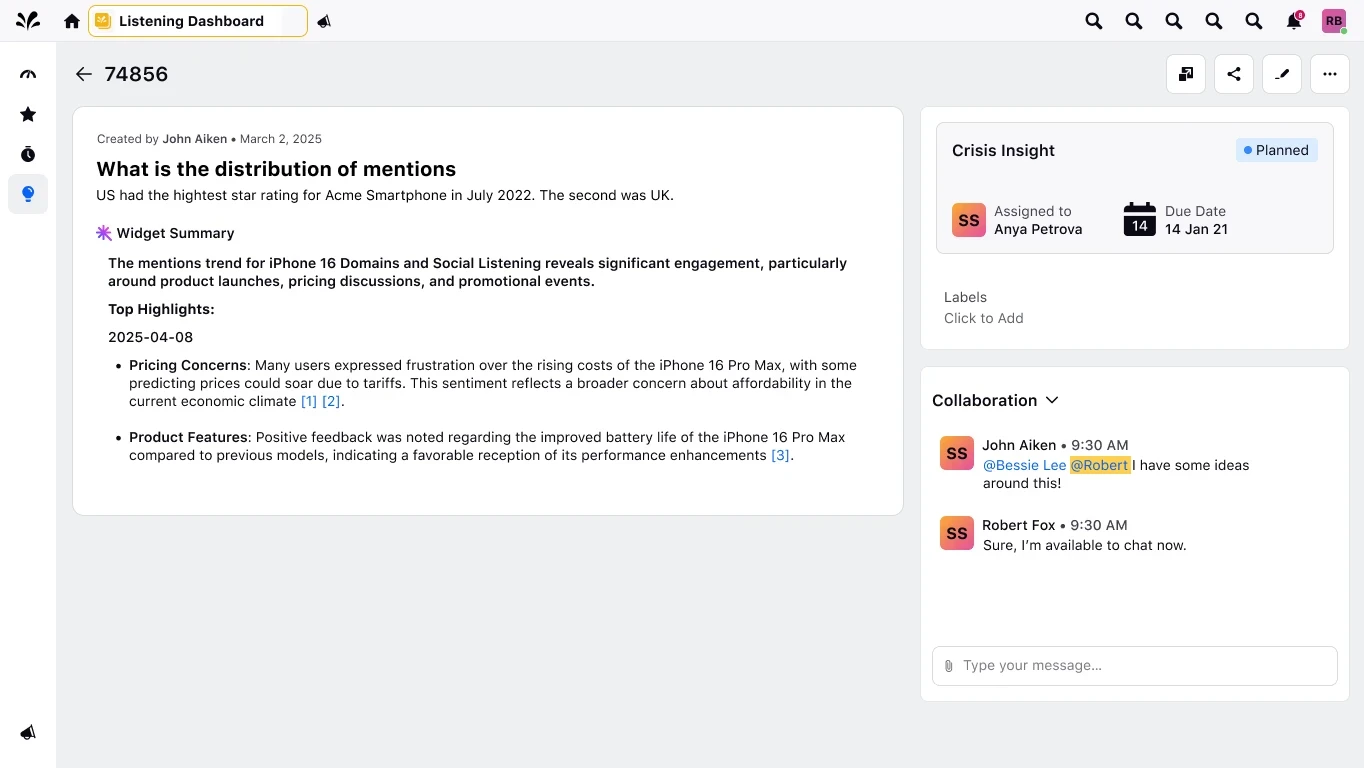
Track progress in one hub, where every update stays linked to the original insight.
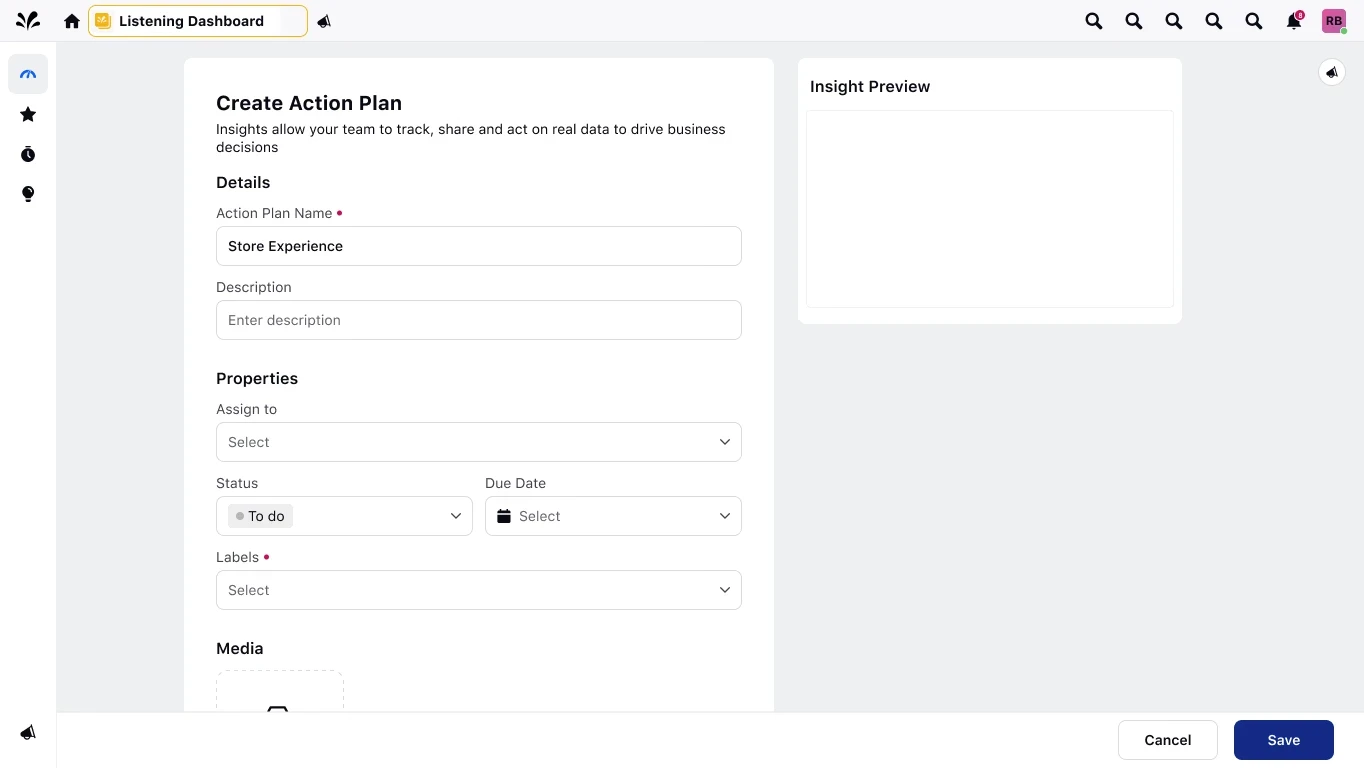
Iteration · Scale
From one insight to many
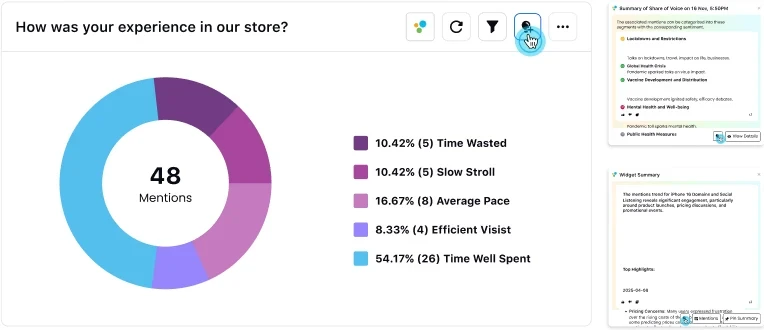
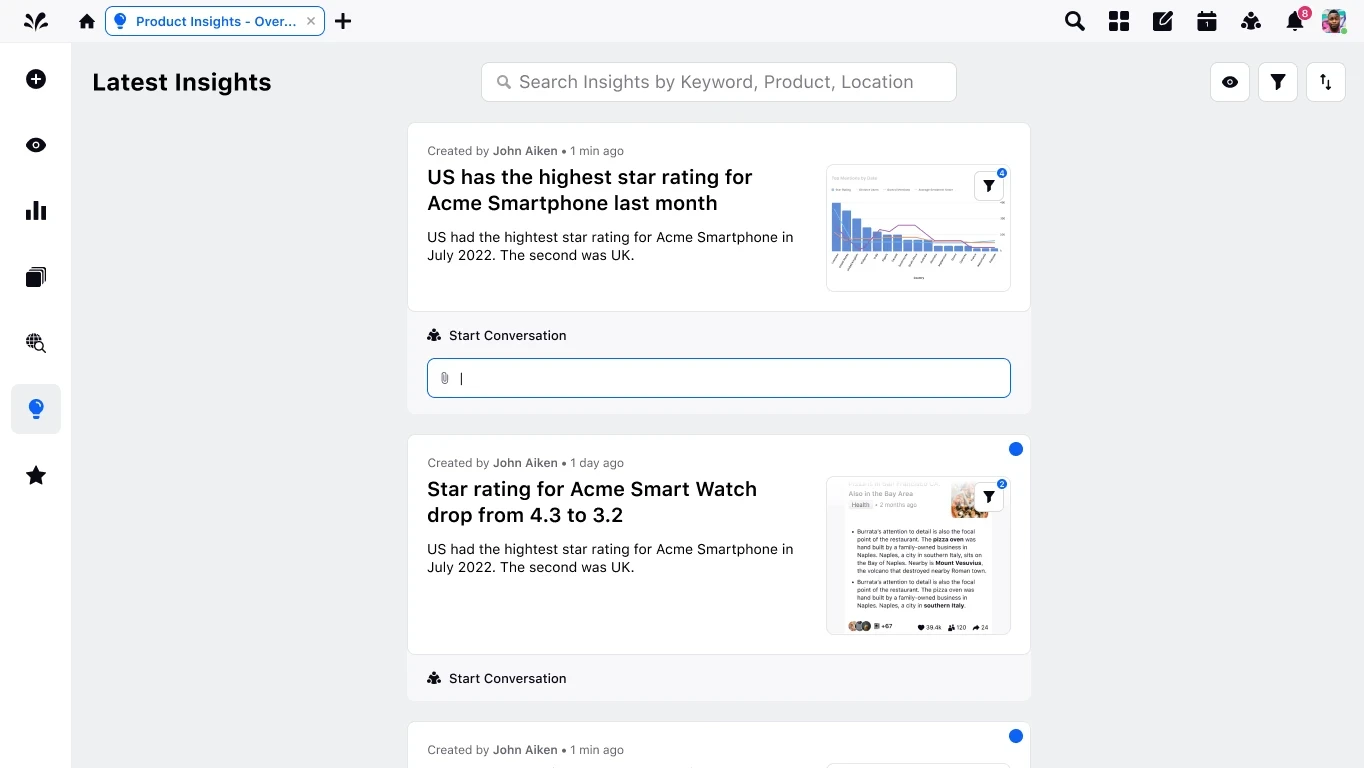
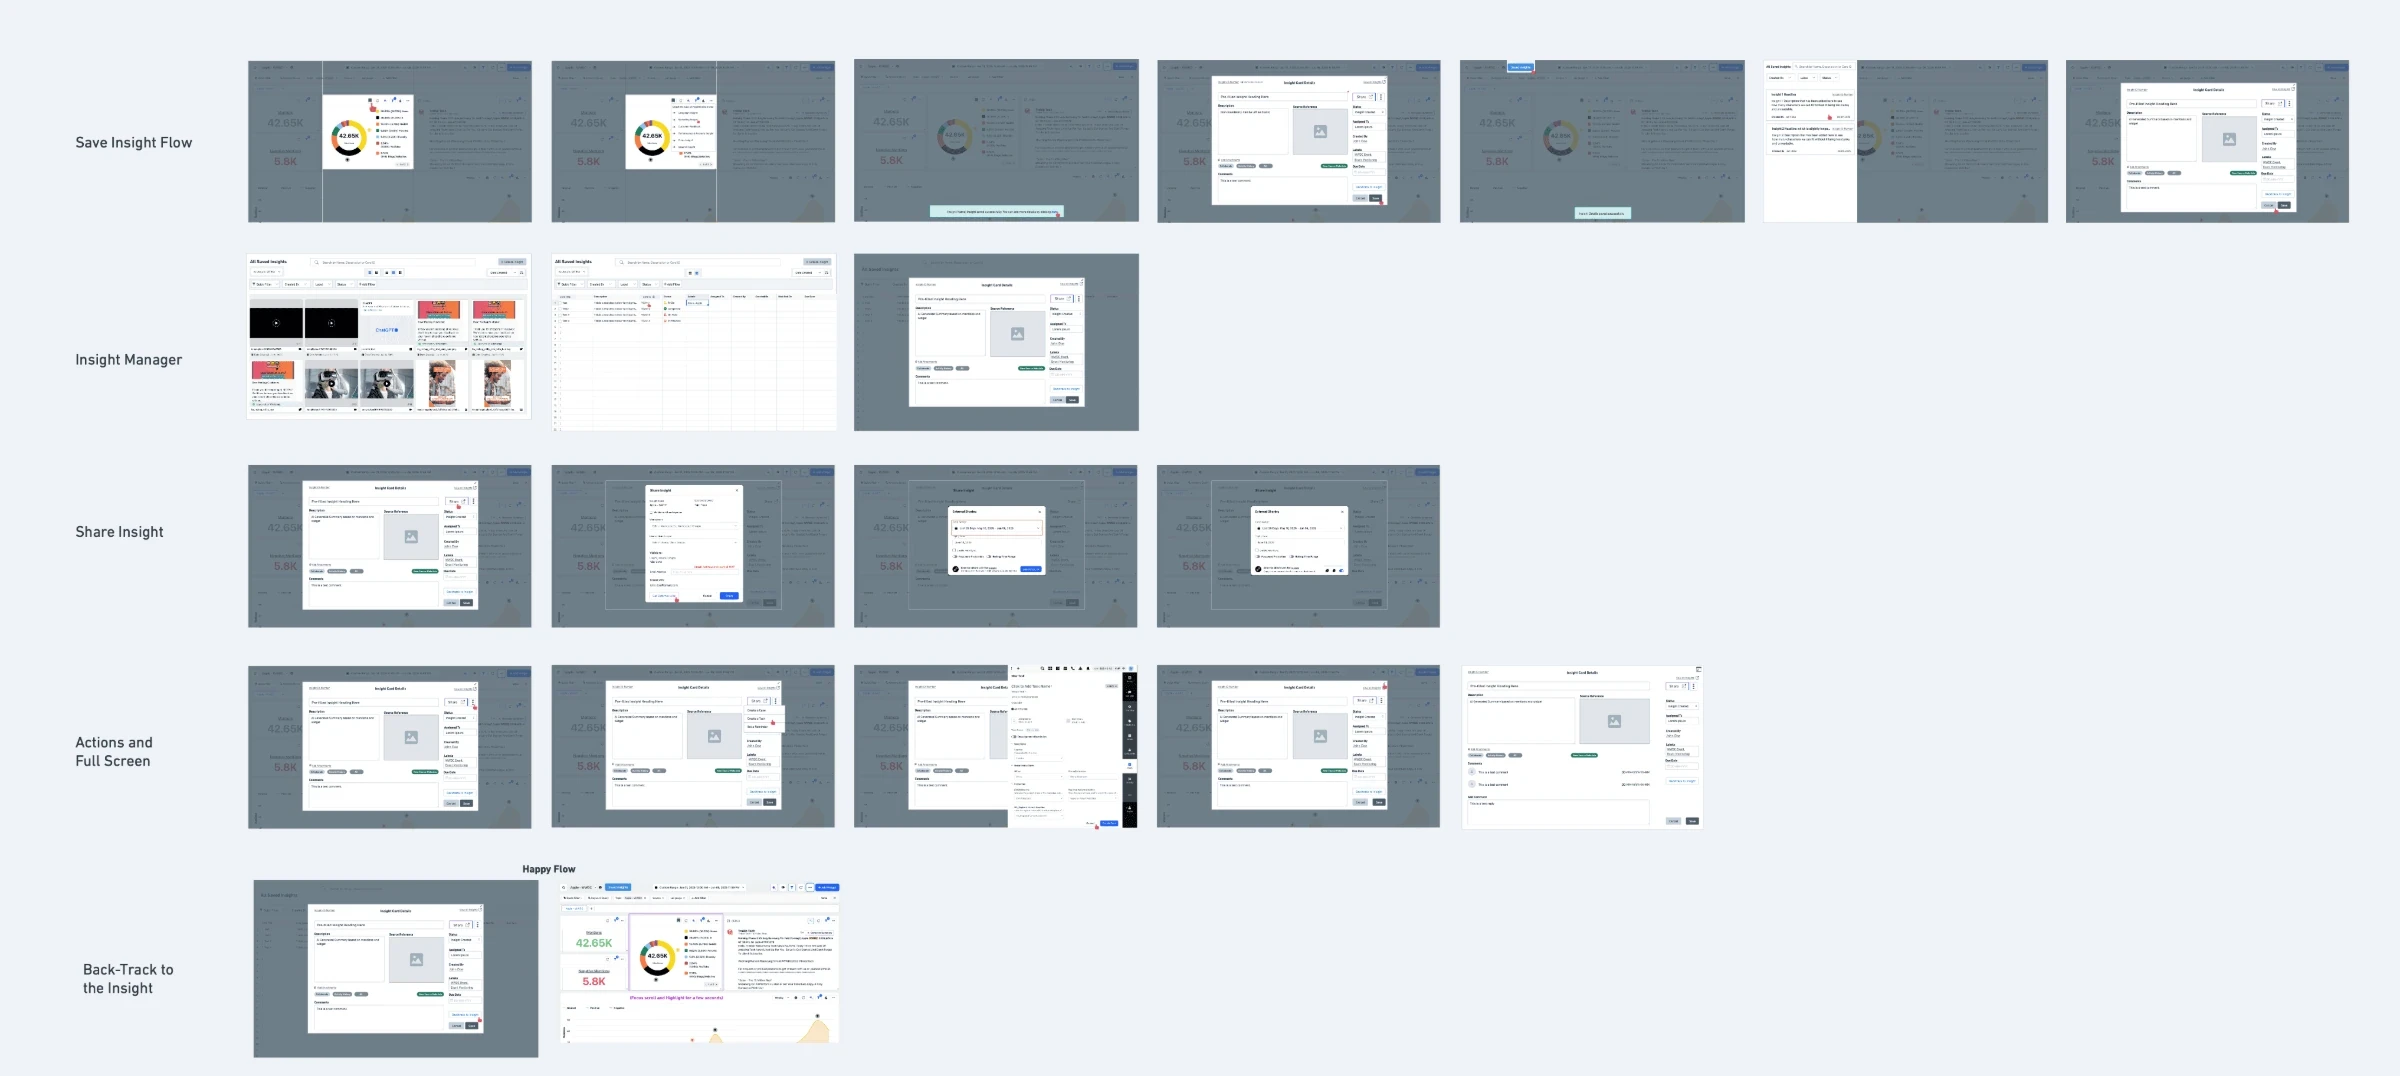
Our first design handled one insight at a time. It was clear and simple, but it limited people who needed to compare insights across themes.
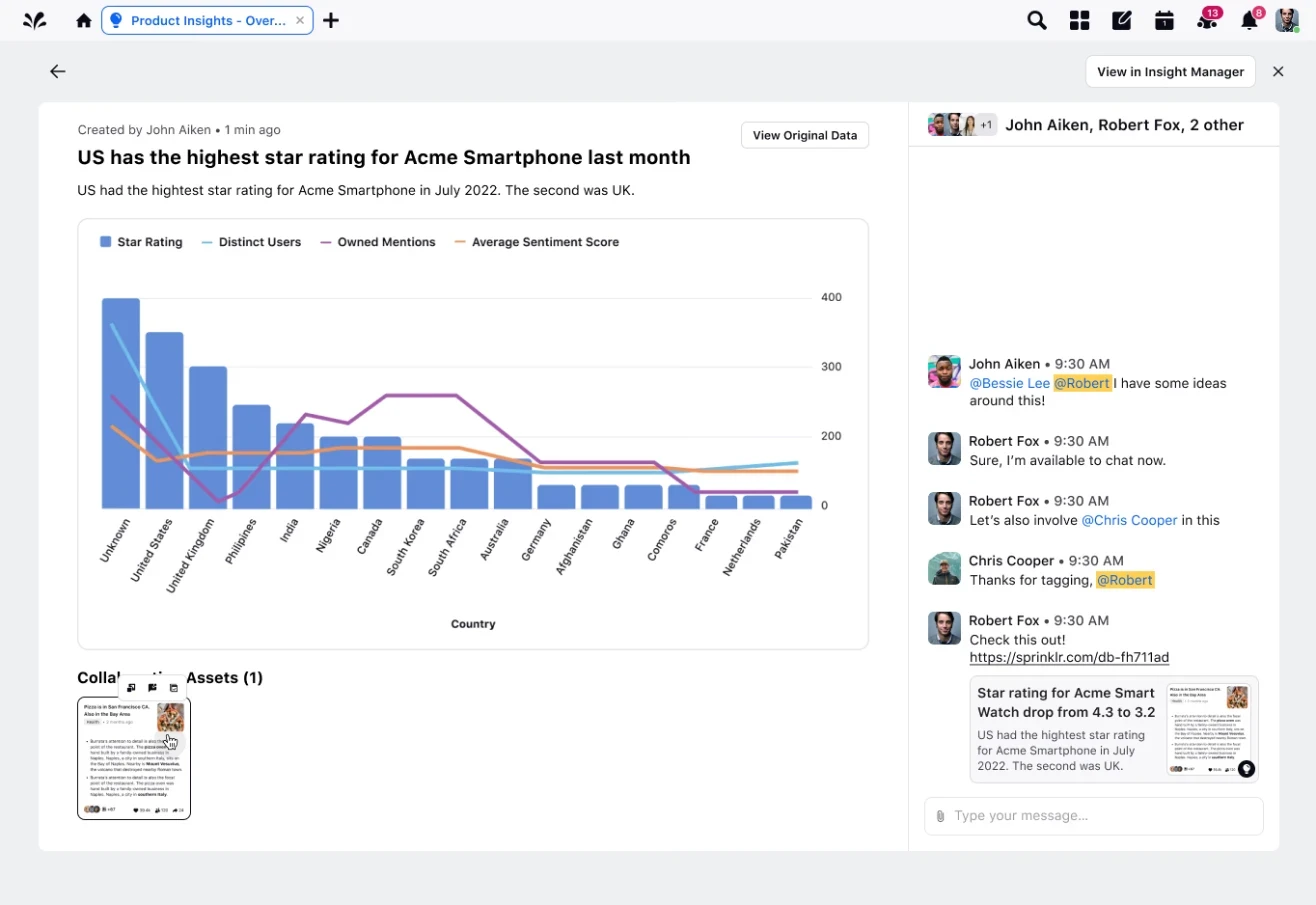
We expanded it to support many insights at once, so teams could view, curate and act on several together. That made for richer stories and faster decisions, without hurting usability.
Impact
From reporting to decisions
For users
One place for insights
A single space to capture and connect insights across teams.
Less searching, more acting
Teams spend their time on the insight, not on finding it again.
Shared visibility
Owners and status are clear, which drives alignment and accountability.
For Sprinklr
Product differentiation
Sprinklr Insights moves from reporting dashboards to a decision-making platform.
Adoption and retention
Insights become more useful and shareable, which drives repeat engagement.
CTO Award
The Insights Use Case Hub earned Sprinklr’s CTO Award in September 2025.
What's next
Phase 2: AI on top of the framework
I designed with the Hyperspace design system team, adding new components to it, and worked directly with engineers on design QA. Phase 2 brings the co-pilot into the workflow.
01
Summarise with AI
Once data, widgets and messages are gathered around an insight, AI writes a summary that is easy to share.
02
Conversational prompts
Ask "Which campaigns need attention?" instead of navigating filters and widgets.
03
Dashboard intelligence
Co-pilot scans several dashboards and surfaces patterns, anomalies and what needs action.
04
Instant insight creation
Turn an issue AI highlights into an insight, with context, collaborators and next steps.
Next case study